SuperTrend Indicator The Myth ?
Trend Following Indicator
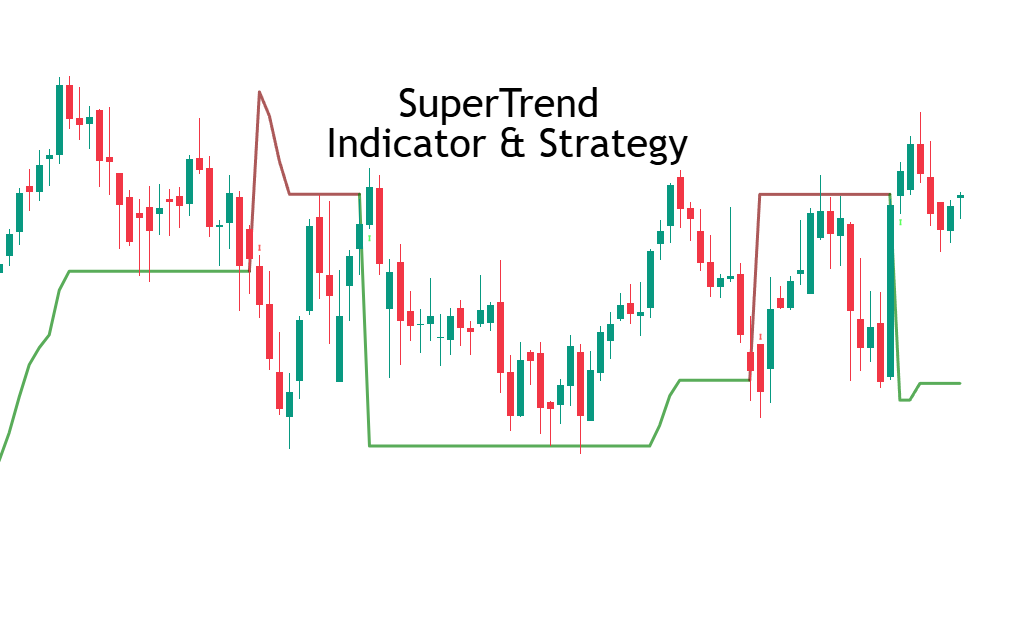
What is Supertrend ?
Supertrend is calculated from ATR (Average True Range) and Multiplier
Calculation — Step by Step
Example:
-
ATR period = 10 (average range of last 10 candles)
-
Multiplier = 3
Step 1: Calculate ATR
Get True Range average of last 10 candles . ATR = 50.
Step 2: Calculate Basic Band
-
Upper Band = (High + Low) / 2 + (Multiplier × ATR)
-
Lower Band = (High + Low) / 2 – (Multiplier × ATR)
This bands create line above and below of price.
Step 3: Adjustment basis of Close Price
-
If candle close above upper band → Supertrend green (buy mode)
-
If candle close below lower band → Supertrend red (sell mode)
Step 4: Flip (When line revers)
-
Supertrend only change color when price break and touch or close above opposite band.
-
Supertrend value change on each candle like ema or other indicator its has average range of candle that’s why if range is volatile then the band/line can change if atr range is small then line will flat.
Example: Above image you see price close above red supertend where it confirm flip and resistance break then bias change to bullish and price slowly come to green line supertrend while green line almost flat that’s show after breaking supertrend price volatility reduce because atr range is not expending thats why supertrend line was also flat.
One more example with number for more clear understanding:
Xyz Symbol ATR (10,3) = 80 points.
-
Candle High-Low average (median price) = 22600
-
Upper Band = 22600 + (3 × 80) = 22840
-
Lower Band = 22600 – (3 × 80) = 22360
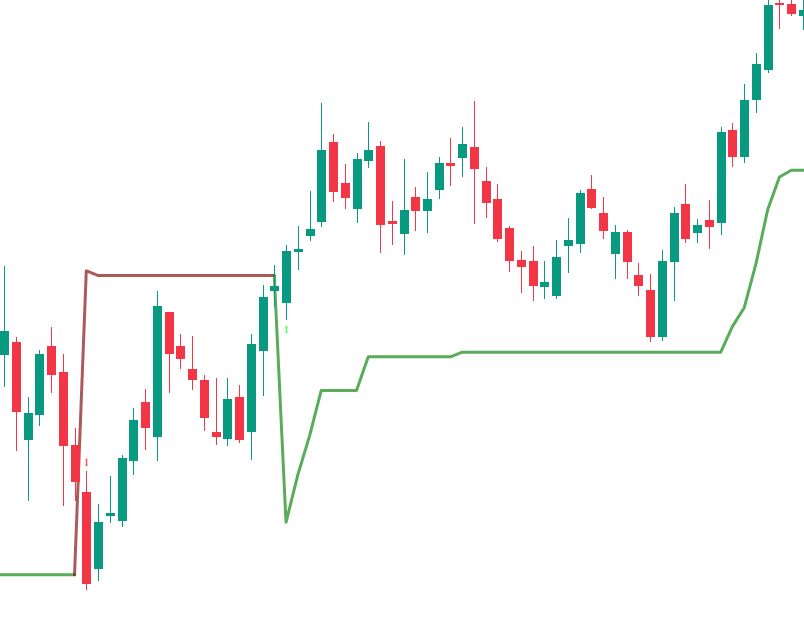
If price close above upper band and goes to 22850 → Supertrend will turn into green line. Next candle has lower band with green line which will act as a support or trailing stoploss or new entry when price come to again green line.
Until price close below green line then trend bias will bullish.
Best Supertrend Settings
- ATR Period 14 Multiplier 3 Timeframe 5 min.
- ATR Period 28 Multiplier 6 Timeframe 15 min.
| Trading Style | ATR Period | Multiplier | Timeframe |
|---|---|---|---|
| Scalping | 7 | 2 | 5-min or 3-min |
| Intraday (Momentum) | 14 | 3 | 15-min |
| Intraday (Safe) | 28 | 6 | 15-min or 30-min |
| Swing (2-5 Days) | 36 | 12 | 1-hour |
| Positional (For Weeks) | 72 | 24 | Daily |
You can increase according your timeframe because you need to find your edge which timeframe suit you.
Multi-Timeframe SuperTrend Strategy
Now this is interesting part using multi timeframe supertrend give you clear picture of what happening you can start with bigger timeframe if daily bias is bullish then check 15min or 1h if that’s also giving same bias then it will be best.